Kuerschner (talk | contribs) No edit summary |
Kuerschner (talk | contribs) No edit summary |
||
| Line 1: | Line 1: | ||
3D Bode plot of the transfer function of the [[Power_system_examples|New England]] test system. Image origin and more information can be found in <ref name="Kue10"></ref>. | 3D Bode plot and (dominant poles) of the transfer function <math>H(s)</math> of the [[Power_system_examples|New England]] test system. Image origin and more information can be found in <ref name="Kue10"></ref>. | ||
The poles of <math>H(s)</math> (eigenvalues of | |||
<math>(A,E)</math>) are marked as black dots in the <math>\real(s)-\Im(s)</math>-plane. The thick blue dots mark the dominant poles. | |||
==References== | ==References== | ||
<references> | <references> | ||
Latest revision as of 10:39, 25 April 2013
3D Bode plot and (dominant poles) of the transfer function of the New England test system. Image origin and more information can be found in [1]. The poles of (eigenvalues of ) are marked as black dots in the -plane. The thick blue dots mark the dominant poles.
References
<references> [1] </ references>
- ↑ 1.0 1.1 P. Kürschner, "Two-sided eigenvalue methods for modal approximation”, Master’s thesis, Chemnitz University of Technology, Department of Mathematics, Germany, 2010.
File history
Click on a date/time to view the file as it appeared at that time.
| Date/Time | Thumbnail | Dimensions | User | Comment | |
|---|---|---|---|---|---|
| current | 07:11, 25 April 2013 | 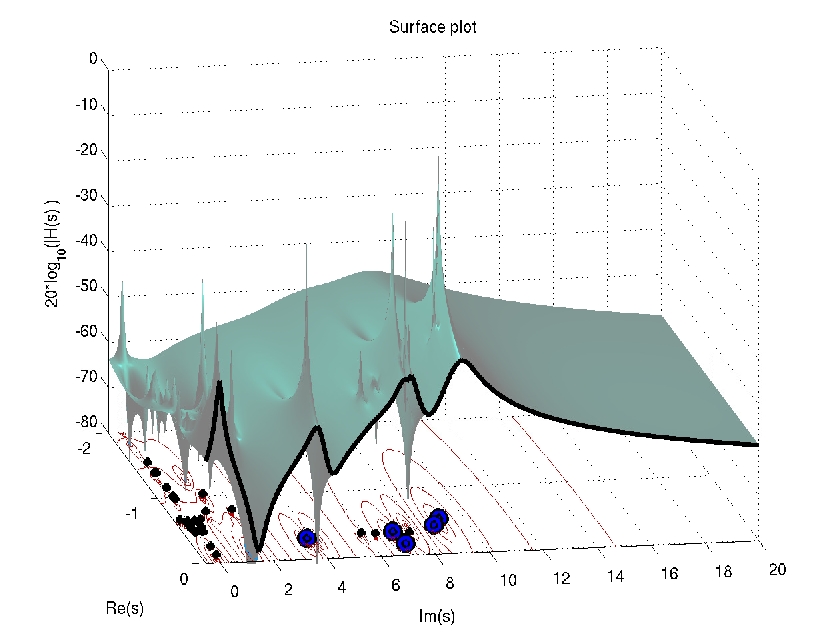 | 837 × 633 (162 KB) | Kuerschner (talk | contribs) | 3D Bode plot of a transfer function |
You cannot overwrite this file.
File usage
The following page uses this file: