m (→Plots) |
(→Plots) |
||
| Line 77: | Line 77: | ||
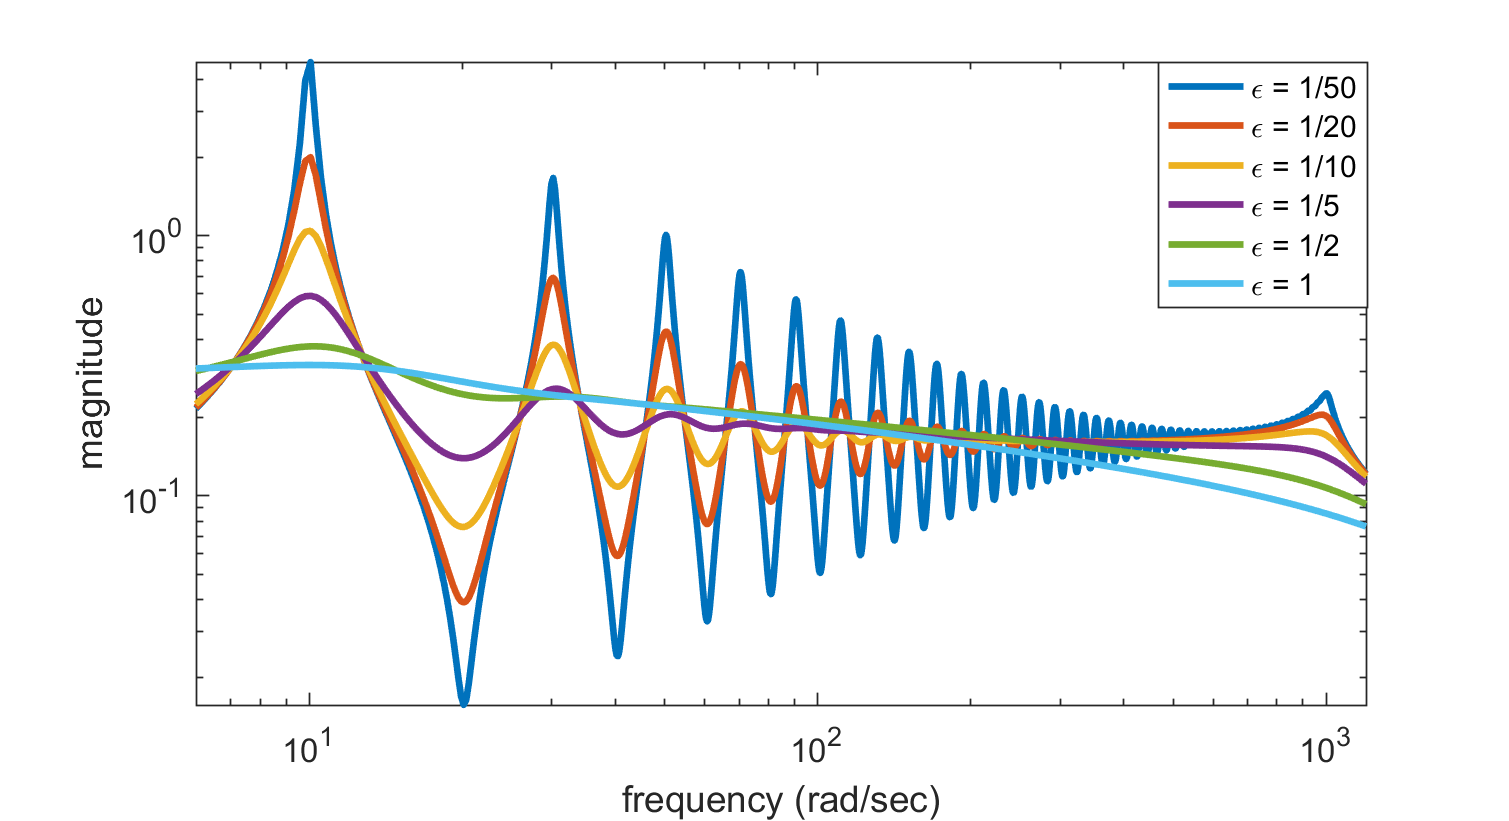
We plot the frequency response for a few different parameter values <math>\varepsilon \in [1/50; 1/20; 1/10; 1/5; 1/2; 1] </math> |
We plot the frequency response for a few different parameter values <math>\varepsilon \in [1/50; 1/20; 1/10; 1/5; 1/2; 1] </math> |
||
| + | :[[Image:synth_freq_resp.png|Frequency response of synthetic parametrized system, for parameter values 1/50 (blue), 1/20 (green), 1/10 (red), 1/5 (teal), 1/2 (purple), 1 (yellow).]] |
||
| − | :[[Image:Freq_resp.png|Frequency response.]] |
||
Revision as of 13:07, 29 November 2011
Introduction
On this page you will find a purely synthetic parametric model. The goal is to have a simple parametric model which one can use to experiment with different system orders, parameter values etc.
System description
The parameter  scales the real part of the system poles, that is,
  .
For a system in pole-residue form
we can write down the state-space realisation  with
with
Notice that the system matrices have complex entries.
For simplicity, assume that  is even,
  , and that all system poles are complex and ordered in complex conjugate pairs, i.e.
and the residues also form complex conjugate pairs
Then a realization with matrices having real entries is given by
with ![A_{\varepsilon,i} = \left[\begin{array}{cc} a_i& 0 \\ 0 & a_i \end{array}\right]](/morwiki/images/math/c/4/d/c4daf85733e144db5528fb1a97dcc3b1.png) ,
,
![A_{0,i} = \left[\begin{array}{cc} 0& b_i \\ -b_i & 0 \end{array}\right]](/morwiki/images/math/9/c/e/9cefed461140230838eec45e4654af4a.png) ,
,
![B_{i} = \left[\begin{array}{c} 2 \\ 0 \end{array}\right]](/morwiki/images/math/1/6/d/16d6f95252fffc0c7217cb71546f9dff.png) ,
,
![C_{i} = \left[\begin{array}{cc} c_i& d_i\end{array}\right]](/morwiki/images/math/3/b/7/3b78f9392f071a38a8ecf9d7d1af9ee6.png) .
.
Numerical values
We construct a system of order  . The numerical values for the different variables are
 equally spaced in
 ![[-10^3, -10]](/morwiki/images/math/0/1/e/01eb0216a83386dce806710ccd49014d.png) ,
,
 equally spaced in
 ![[10, 10^3]](/morwiki/images/math/0/b/e/0be1e9dea133f5e55f228e67a2ea56b4.png) ,
,
 ,
,
 ,
,

![\in [1/50,1]](/morwiki/images/math/3/4/0/3409a13a32f034288c27700bb927d09e.png) .
.
In MATLAB the system matrices are easily formed as follows
n = 100;
a = -linspace(1e1,1e3,n/2).';   b = linspace(1e1,1e3,n/2).';
c = ones(n/2,1);                d = zeros(n/2,1);
aa(1:2:n-1,1) = a;              aa(2:2:n,1) = a;
bb(1:2:n-1,1) = b;              bb(2:2:n-2,1) = 0;
Ae = spdiags(aa,0,n,n);
A0 = spdiags([0;bb],1,n,n) + spdiags(-bb,-1,n,n);
B = 2*sparse(mod([1:n],2)).';
C(1:2:n-1) = c.';               C(2:2:n) = d.';   C = sparse(C);
Plots
We plot the frequency response for a few different parameter values ![\varepsilon \in [1/50; 1/20; 1/10; 1/5; 1/2; 1]](/morwiki/images/math/7/1/9/7198d58172e8c154388a92cce649bafe.png)


![\varepsilon \widehat{A}_\varepsilon + \widehat{A}_0 = \varepsilon \left[\begin{array}{ccc} a_1 & & \\ & \ddots & \\ & & a_n\end{array}\right] +\left[\begin{array}{ccc} jb_1 & & \\ & \ddots & \\ & & jb_n\end{array}\right] ,](/morwiki/images/math/7/9/0/790c70f3fdd1a7fe269be673f52f5e8c.png)
![\widehat{B} = [1,\ldots,1]^T,\quad \widehat{C} = [r_1,\ldots,r_n],\quad D = 0.](/morwiki/images/math/0/1/9/01952f4b905489c1f4686227dc13e409.png)


![A_\varepsilon = \left[\begin{array}{ccc} A_{\varepsilon,1} & & \\ & \ddots & \\ & & A_{\varepsilon,k}\end{array}\right], \quad A_0 = \left[\begin{array}{ccc} A_{0,1} & & \\ & \ddots & \\ & & A_{0,k}\end{array}\right], \quad B = \left[\begin{array}{c} B_1 \\ \vdots \\ B_k\end{array}\right], \quad C = \left[\begin{array}{ccc} C_1 & \cdots & C_k\end{array}\right], \quad D = 0,](/morwiki/images/math/f/2/4/f24f26251cc0c24bed73a958735c4681.png)
